![[Ready To Publish] What Lies Inside the Decade-Long Black Box of AI VC Investments_Milad Khademi_IMAGE](https://heckelai.com/wp-content/uploads/2026/09/Ready-To-Publish-What-Lies-Inside-the-Decade-Long-Black-Box-of-AI-VC-Investments_Milad-Khademi_IMAGE.png)
Over the past decade, artificial intelligence has moved from a promising research niche to the single largest destination for venture capital anywhere in the world. The eight charts that follow, drawn from different sources, trace that rise from three angles: how AI compares to every other technology vertical, how it plays out across leading markets and industries, and where inside AI itself the money is actually going. Read as a whole, this article tells a more specific story than “AI is hot”: venture capital has been rotating away from the consumer-facing applications that made AI famous and toward the infrastructure that makes those applications possible in the first place.
There is also a second story running through all eight charts, and it is the key to reading them: what fell under the category of “AI” ten years ago represented a much narrower set of activities than what the AI category encompasses today. A decade ago, AI venture capital meant almost entirely AI applications; today the same label also covers chips, computing infrastructure, foundation models, data preparation, agents, and AI safety. AI’s rise is therefore not only more money flowing into the same thing, but also a much bigger thing being called AI.
AI Takes Over Venture Capital from Rank Eight to Rank One
 Figure 1. Top 20 Verticals by Global VC Deal Value Ranks, 2015–2025. Source: PitchBook
In 2015, Artificial Intelligence & Machine Learning ranked eighth among the top 20 venture capital verticals; by 2025 it ranks first. AI’s climb is constantly rising or holding steady in nearly every year, while categories like Cryptocurrency/Blockchain swing wildly between 14th and 20th place and former leaders such as Technology, Media & Telecommunications (TMT) collapse from first in 2015 to eighteenth in 2025.
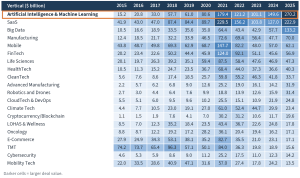 Figure 2. Top 20 Verticals by Global VC Deal Value Amounts, 2015–2025 ($B). Source: PitchBook
The dollar figures make the same point more starkly. AI investment grew roughly eighteenfold in a decade, from $15.2 billion in 2015 to $270.2 billion in 2025. That 2025 amount is remarkable; it exceeds the combined 2025 investment across the bottom twelve verticals on this same table (from CleanTech down to Mobility Tech) which together total roughly $260 billion. A single vertical is now out-investing an entire long tail of a dozen other established industries put together. Part of that growth, as the later charts show, also reflects a wider definition: many activities counted as AI in 2025 were simply not part of the category in 2015. A decade of deal data shows artificial intelligence didn’t just join the top of the venture capital league table; it takes all of it.
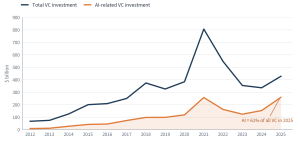 Figure 3. AI-Related vs. Total Venture Capital Investment, 2012–2025. Source: OECD.ai
In 2025, AI accounted for 61% of all global VC investment, more than double its 30% share in 2022. What stands out most is the contrasting paths of the two series. Overall venture funding crested near $800 billion in 2021 and, by 2025, still sits roughly 47% beneath that mark. AI funding, however, has nearly regained its own 2021 high.
Generative AI Is 16% of the Whole Story
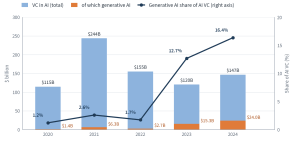 Figure 4. Global Venture Capital Investment in AI and Generative AI, 2020–2024. Source: OECD.ai
Generative AI accounted for just 16% of all AI venture capital in 2024, up from only 1.2% in 2020. That is a useful corrective to the popular narrative that generative AI is the whole story. But the 16% figure can also mislead if we don’t care about amounts of investments. Generative AI dollars still grew roughly seventeenfold in four years, from $1.4 billion to $24 billion. After realizing that, the big question is if only 16 percent of AI VC investments go to generative AI, so where does the rest go?
The Real AI Boom Is Underground: Infrastructure, Models, and Chips
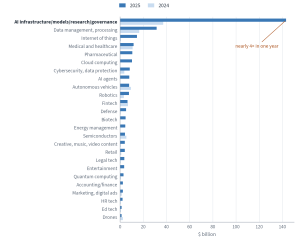 Figure 5. Global Private Investment in AI by Focus Area, 2024 vs. 2025. Source: AI Index Report 2026
AI infrastructure, models, research, and governance jumped from roughly $37 billion in 2024 to an estimated $140 billion in 2025; nearly a fourfold increase in a single year, larger than the year-over-year change in every other category combined. It is also worth noting what did not grow, categories like: autonomous vehicles, semiconductors, and drones, appear to have declined slightly year over year. It is a highly concentrated bet on foundational layers. Just as telling are the categories with no 2024 figure at all, such as AI agents, pharmaceuticals, cloud computing, biotech, and energy management, which appear in the data for the first time: another sign of how quickly the AI label is widening.
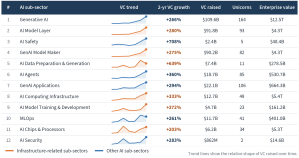 Figure 6. Two-Year VC Growth, Unicorn Formation, and Recent Funding Scale Across AI Sub-Sectors. Source: Dealroom
 Figure 7. The Same Data in Chart Form: VC Raised, Enterprise Value, and Unicorn Count by Sub-Sector. Source: Dealroom
Figure 6 shows two-year trends in VC investments in different areas of AI. Examining the two-year trend reveals that there are many new areas of AI that basically did not exist before 2024. This is the clearest evidence of the point made at the start of this article: the boundaries of “AI” keep moving outward, so today’s AI totals cover far more ground than those of a decade ago. We can also see how valuable and profitable each area is by comparing the values of companies in each area and the number of unicorns created from these areas.
Figure 7 displays the information in the previous figure in a graph that is more comparable. We still see that the number of unicorns and their enterprise value in generative AI are at the highest level, but if we look more closely, we understand that the sum of the areas related to the field of artificial intelligence infrastructure (highlighted in orange), such as AI model layer, Gen AI model maker, AI data preparation & generation, AI computing infrastructure, AI model training & development and AI chips & processors is at the highest level. It is not wrong to say that 2024 and 2025 have been the years of attention to artificial intelligence infrastructure.
Applications Built the Boom, Infrastructure Is Rebuilding the Applications
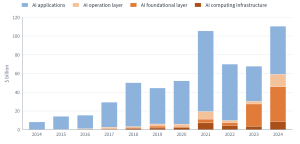 Figure 8. Global AI Venture Capital Investment by Layer, 2014–2024. Source: Dealroom
This chart is arguably the clearest single summary of everything above it. For most of the past decade, AI applications, meaning the visible, consumer- and enterprise-facing products, made up the overwhelming majority of AI venture capital, with the foundational layer and computing infrastructure appearing as thin slivers at the base of the bar. In other words, a decade ago “AI investment” was, in practice, almost a synonym for “AI applications.” That composition has changed sharply since 2023. The foundational layer alone has grown to roughly a third of total AI investment, and combined with the operation layer and computing infrastructure, the “back-end” of AI now accounts for more capital than applications do.
Conclusion: The Pendulum Between Applications and Infrastructure
Put together, these charts support a clear, layered conclusion. Artificial intelligence is now the dominant venture capital vertical, and a far broader category than the one that ranked eighth in 2015. Yet the popular image of this boom (chatbots, copilots, and generative AI demos) captures only a modest slice of the underlying capital. The larger and faster-moving story is a rotation toward infrastructure. A reasonable reading of the sequence is that the technology leaders driving this boom recognized, two to three years ago, that the AI infrastructure of the time could not support the scale of application-layer returns the industry was promising, so capital rotated toward building that infrastructure first. If that reading is correct, a stronger infrastructure base should now be able to support a new wave of applications with a higher return on investment.
Strategic Implications for Business Leaders
Where a given business should place its bets depends on its position in the AI value chain and its appetite for risk. In the next 12 months, with a stronger infrastructure base now in place, capital and customer attention are rotating back toward the application layer, which favors businesses that already own distribution, customer relationships, and proprietary data. Over one to three years, since capital has historically swung between infrastructure and applications, the better move is to build optionality, through compute partnerships and modular architectures that can absorb next-generation models, rather than over-commit to either pole. Beyond three years, small but fast-growing frontiers such as AI safety and governance, agentic systems, and next-generation compute will reward patient capital. The one constant in this data set is rotation, not steady linear growth, so the businesses best placed for the next turn of the cycle are those that can operate across all three horizons at once, although that requires an ecosystemic business model not every enterprise has.